Administrative region in Northwest Territories, Canada
North Slave Region communities in the Northwest Territories
The North Slave Region or Tłicho Region is one of five administrative regions in the Northwest Territories of Canada. It is the most populous of the five regions, with a population of almost 23,000. According to Municipal and Community Affairs the region consists of eight communities with the regional office situated in Yellowknife and a sub-office in Behchokǫ̀ .[ 1] First Nations .
Communities
The North Slave Region includes the following communities:
Historical population Year 2001 21,037 — 2002 21,751 +3.4% 2003 22,613 +4.0% 2004 23,041 +1.9% 2005 23,091 +0.2% 2006 22,990 −0.4% 2007 23,157 +0.7% 2008 23,304 +0.6% 2009 23,133 −0.7%
Year 2010 23,199 +0.3% 2011 23,478 +1.2% 2012 23,595 +0.5% 2013 23,817 +0.9% 2014 23,955 +0.6% 2015 24,271 +1.3% 2016 24,588 +1.3% 2017 24,585 −0.0%
Sources: NWT Bureau of Statistics (2001 - 2017)[ 8]
Communities of the North Slave Region
Communities of the North Slave Region
Gas station at Behchokǫ̀ (2009)
Dettah government building ((2011)
Łutselk'e ((2006)
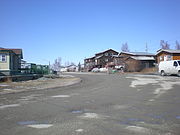
Ndilǫ street (2011)
Wekweètì (2006)
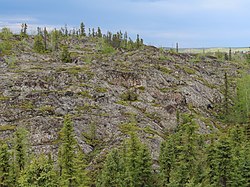
Trail near Whatì (2014)
Looking towards downtown Yellowknife (2018)
Climate
Climate data for Gamèti (Rae Lakes)64°06′43″N 117°19′41″W / 64.11194°N 117.32806°W / 64.11194; -117.32806 (Rae Lakes )
Month
Jan
Feb
Mar
Apr
May
Jun
Jul
Aug
Sep
Oct
Nov
Dec
Year
Record high humidex
−1.1
−1.8
8.1
19.1
26.7
33.9
36.4
31.9
26.2
17.8
3.3
1.4
36.4
Record high °C (°F)
−0.8
−1.4
9.4
19.2
26.7
32.6
32.0
31.7
23.6
18.3
5.0
1.7
32.6
Mean daily maximum °C (°F)
−22.7
−18.3
−11.4
1.3
8.9
17.9
21.5
17.1
10.1
−0.2
−11.0
−17.1
−0.3
Daily mean °C (°F)
−27.1
−23.6
−18.5
−5.9
3.4
12.9
16.8
13.2
7.0
−2.7
−14.5
−21.5
−5.0
Mean daily minimum °C (°F)
−31.5
−28.9
−25.4
−13.1
−2.2
7.9
12.2
9.2
3.8
−5.2
−18.1
−25.9
−9.8
Record low °C (°F)
−51.5
−47.8
−46.6
−35.5
−22.3
−1.0
−0.1
−1.0
−7.7
−28.1
−41.3
−47.1
−51.5
Record low wind chill
−53.6
−60.4
−51.5
−43.3
−30.7
−6.1
0.0
0.0
−13.4
−33.3
−45.4
−53.0
−60.4
Average relative humidity (%) (at 1500 LST )
73.2
72.3
60.5
54.0
50.4
45.7
49.6
59.8
69.6
79.5
84.3
80.9
65.0
Source: Environment and Climate Change Canada [ 9]
Climate data for Yellowknife (Yellowknife Airport )WMO ID : 71936; coordinates 62°27′46″N 114°26′25″W / 62.46278°N 114.44028°W / 62.46278; -114.44028 (Yellowknife Airport )
Month
Jan
Feb
Mar
Apr
May
Jun
Jul
Aug
Sep
Oct
Nov
Dec
Year
Record high humidex
2.9
6.1
8.9
20.2
25.7
34.0
35.4
34.3
27.2
18.1
6.3
1.6
35.4
Record high °C (°F)
3.4
6.2
9.3
20.4
26.3
31.1
32.5
32.6
26.1
19.0
7.8
2.8
32.6
Mean daily maximum °C (°F)
−21.6
−18.0
−10.6
0.3
10.4
18.6
21.5
18.4
10.9
1.5
−9.0
−18.0
0.4
Daily mean °C (°F)
−25.5
−22.7
−16.6
−5.5
5.3
13.8
17.1
14.5
7.6
−1.0
−12.6
−21.8
−4.0
Mean daily minimum °C (°F)
−29.4
−27.4
−22.5
−11.3
0.1
9.0
12.6
10.5
4.2
−3.6
−16.2
−25.6
−8.3
Record low °C (°F)
−51.2
−51.2
−43.3
−40.6
−22.8
−4.4
0.6
−0.6
−9.7
−28.9
−44.4
−48.3
−51.2
Record low wind chill
−64.0
−61.0
−56.8
−53.2
−31.8
−11.2
0.0
−4.8
−16.4
−36.3
−54.7
−58.9
−64.0
Average precipitation mm (inches)
15.0
11.0
14.1
11.6
16.3
28.9
40.4
44.0
43.0
28.8
25.8
15.1
293.9
Average rainfall mm (inches)
0.0
0.0
0.2
2.9
12.2
28.0
40.4
44.0
39.9
12.0
0.5
0.0
180.2
Average snowfall cm (inches)
21.7
16.1
19.2
9.9
4.5
0.0
0.0
0.0
3.0
20.1
36.9
23.7
155.0
Average precipitation days (≥ 0.2 mm)
11.1
9.3
8.6
4.8
5.7
7.0
9.5
11.2
12.2
13.7
14.6
11.5
119.1
Average rainy days (≥ 0.2 mm)
0.09
0.04
0.25
1.2
4.4
6.8
9.5
11.2
11.6
5.8
0.82
0.13
51.9
Average snowy days (≥ 0.2 cm)
12.4
10.3
9.5
4.1
1.9
0.04
0.0
0.0
1.2
9.6
16.0
13.2
78.2
Average relative humidity (%) (at 15:00 LST)
68.5
64.6
56.4
52.8
46.0
45.3
49.0
57.1
64.7
75.9
80.7
73.0
61.2
Mean monthly sunshine hours
50.6
107.3
188.4
276.4
335.7
373.8
358.0
276.2
157.7
65.0
42.7
24.6
2,256.5
Percent possible sunshine
26.8
43.5
51.8
62.2
60.8
63.0
61.2
55.5
40.3
21.0
20.2
15.4
43.5
Average ultraviolet index
0
0
1
2
4
5
5
4
2
1
0
0
2
Source 1: Environment and Climate Change Canada [ 10] [ 11] [ 12]
Source 2: Weather Atlas[ 13]
Climate data for WhatìWMO ID : 71163; Climate ID: 2202678; coordinates 63°08′01″N 117°14′41″W / 63.13361°N 117.24472°W / 63.13361; -117.24472 (Whatì )
Month
Jan
Feb
Mar
Apr
May
Jun
Jul
Aug
Sep
Oct
Nov
Dec
Year
Record high humidex
3.9
6.5
12.7
17.1
29.1
37.7
36.8
35.2
32.3
17.8
5.4
6.1
37.7
Record high °C (°F)
4.1
7.0
13.1
19.6
29.1
33.6
33.7
34.4
30.9
18.0
5.6
6.3
34.4
Mean daily maximum °C (°F)
−20.6
−16.9
−10.3
1.3
11.7
19.5
22.4
18.8
11.8
0.8
−10.2
−18.1
0.9
Daily mean °C (°F)
−25.1
−22.6
−17.6
−6.0
5.6
13.5
16.4
13.1
6.9
−2.5
−14.4
−22.5
−4.6
Mean daily minimum °C (°F)
−29.4
−28.2
−24.9
−13.4
−0.5
7.4
10.4
7.4
1.9
−5.7
−18.6
−26.9
−10.0
Record low °C (°F)
−48.4
−47.4
−46.3
−41.6
−24.4
−5.1
−2.0
−3.3
−9.5
−32.4
−39.8
−46.1
−48.4
Record low wind chill
−57.2
−54.8
−55.1
−49.5
−28.2
−13.2
−3.1
−6.8
−17.0
−36.7
−45.2
−53.0
−57.2
Average relative humidity (%) (at 1500 LST )
77.8
73.3
59.3
49.5
46.6
46.7
48.7
57.0
63.7
80.7
85.8
81.0
64.2
Source: Environment and Climate Change Canada [ 14]
Notes
References
External links
Places adjacent to North Slave Region
62°48′09″N 116°02′47″W / 62.80250°N 116.04639°W / 62.80250; -116.04639 (North Slave Region centred on Behchokǫ̀ )


