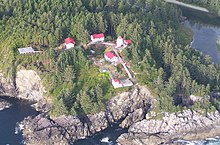
Lighthouse in British Columbia, Canada
Lighthouse
Cape Beale Lightstation is an active manned lighthouse on Vancouver Island in British Columbia , Canada.
History
The lighthouse was built in 1874 and its focal plane is 51 meters above sea level . The present tower was built in 1958 and marks the entrance to Barkley Sound . It is 10 metres tall. Cape Beale received its name from Charles William Barkley , captain of the Imperial Eagle West Coast Trail which is the theoretical route survivors of shipwrecks would take to get to the nearby community of Bamfield .
From 1971 to 1998, the Cape Beale Light was part of the British Columbia Shore Station Oceanographic Program , collecting coastal water temperature and salinity measurements for the Department of Fisheries and Oceans everyday for 27 years.[ 2]
Geography and climate
Cape Beale Light has a rainy and mild Oceanic climate (Köppen : Cfb ; Trewartha : Dolk ).
Climate data for Cape Beale Light48°47′10″N 125°12′58″W / 48.78611°N 125.21611°W / 48.78611; -125.21611 (Cape Beale Light )
Month
Jan
Feb
Mar
Apr
May
Jun
Jul
Aug
Sep
Oct
Nov
Dec
Year
Record high °C (°F)
15.5
18.0
20.0
21.5
25.5
34.5
30.0
32.0
30.0
24.0
17.5
14.0
34.5
Mean daily maximum °C (°F)
8.4
8.9
9.8
11.5
13.9
15.4
16.8
17.0
16.4
13.4
10.4
8.4
12.5
Daily mean °C (°F)
6.1
6.2
7.1
8.6
11.1
12.8
14.1
14.3
13.6
10.8
7.9
5.9
9.9
Mean daily minimum °C (°F)
3.6
3.5
4.2
5.8
8.3
10.1
11.3
11.6
10.7
8.2
5.3
3.5
7.2
Record low °C (°F)
−6.5
−10.0
−3.0
0.5
2.0
4.0
4.0
7.5
5.0
−2.5
−9.0
−8.0
−10.0
Average precipitation mm (inches)
429.6
263.1
290.3
216.5
114.9
98.5
52.1
84.9
121.3
287.7
431.3
386.6
2,776.8
Average rainfall mm (inches)
422.9
260.7
288.5
216.4
114.9
98.5
52.1
84.9
121.3
283.9
430.0
383.5
2,757.5
Average snowfall cm (inches)
2.3
2.4
1.9
0.0
0.0
0.0
0.0
0.0
0.0
0.0
1.4
3.5
11.4
Average precipitation days (≥ 0.2 mm)
22.7
19.0
23.0
19.8
15.4
13.1
11.3
12.8
14.7
20.4
23.9
23.4
221.4
Average rainy days (≥ 0.2 mm)
22.6
18.8
22.9
19.8
15.4
13.1
11.3
12.8
14.7
20.3
23.6
23.2
220.4
Average snowy days (≥ 0.2 cm)
0.70
0.76
0.65
0.03
0.0
0.0
0.0
0.0
0.0
0.04
0.44
0.69
3.3
Source: Environment and Climate Change Canada Canadian Climate Normals 1991–2020[ 3]
See also
References
External links

