1976 United States presidential election in Michigan
1976 United States presidential election in Michigan Turnout 59.4% [ 1]
County results
Ford
40–50%
50–60%
60–70%
70–80%
Carter
40–50%
50–60%
60–70%
The 1976 United States presidential election in Michigan was held on November 2, 1976, as part of the 1976 United States presidential election .
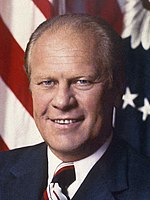
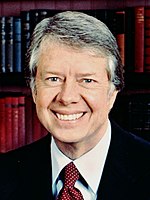
Michigan was won by the incumbent President Gerald Ford , who won his home state with 51.83% of the vote, a victory margin of 5.39 points over Carter, thereby carrying its 21 electoral votes. This result made Michigan about 7.5% more Republican than the nation at large. However, he narrowly lost the general election to Democratic candidate Jimmy Carter . This marked the last time a Democrat won the presidency without carrying Michigan, although Democrats won the popular vote without the state in 2016 . Carter also became the first Democrat to win the White House without carrying Macomb County since Woodrow Wilson in 1916 . The state would not vote for a losing candidate again until 2000, and for the loser of the popular vote until 2004.
As of the 2024 presidential election , this is the final occasion of only four where Michigan and Pennsylvania voted for different presidential candidates ever since the Democrats and Republicans became the two major parties in U.S. politics.[ 2] [ a] Texas , Oklahoma , or Florida ; and that the Democratic candidate lost Michigan but won neighboring Ohio . Gogebic County would not vote more Democratic than Wayne County again until 1984 .
Primaries
Democratic primaries
Republican primaries
Results
Results by county
County
Gerald Ford
Jimmy Carter
Various candidates
Margin
Total votes cast[ 4]
#
%
#
%
#
%
#
%
Alcona
2,328
52.87%
2,038
46.29%
37
0.84%
290
6.58%
4,403
Alger
1,722
41.38%
2,379
57.17%
60
1.44%
-657
-15.79%
4,161
Allegan
19,330
65.59%
9,794
33.23%
347
1.18%
9,536
32.36%
29,471
Alpena
6,380
49.59%
6,310
49.04%
176
1.37%
70
0.55%
12,866
Antrim
4,369
58.11%
3,032
40.33%
117
1.56%
1,337
17.78%
7,518
Arenac
2,687
49.55%
2,695
49.70%
41
0.76%
-8
-0.15%
5,423
Baraga
1,788
49.47%
1,778
49.20%
48
1.33%
10
0.27%
3,614
Barry
11,178
60.79%
6,967
37.89%
243
1.32%
4,211
22.90%
18,388
Bay
23,174
46.64%
25,958
52.24%
557
1.12%
-2,784
-5.60%
49,689
Benzie
3,085
61.23%
1,891
37.53%
62
1.23%
1,194
23.70%
5,038
Berrien
40,835
61.13%
25,163
37.67%
800
1.20%
15,672
23.46%
66,798
Branch
8,251
55.74%
6,301
42.57%
250
1.69%
1,950
13.17%
14,802
Calhoun
30,390
53.77%
25,229
44.64%
901
1.59%
5,161
9.13%
56,520
Cass
9,893
55.15%
7,843
43.72%
203
1.13%
2,050
11.43%
17,939
Charlevoix
5,145
55.57%
3,953
42.70%
160
1.73%
1,192
12.87%
9,258
Cheboygan
4,894
55.13%
3,880
43.70%
104
1.17%
1,014
11.43%
8,878
Chippewa
7,025
53.32%
6,022
45.71%
128
0.97%
1,003
7.61%
13,175
Clare
4,879
53.46%
4,153
45.51%
94
1.03%
726
7.95%
9,126
Clinton
13,475
63.11%
7,549
35.35%
329
1.54%
5,926
27.76%
21,353
Crawford
2,359
54.82%
1,889
43.90%
55
1.28%
470
10.92%
4,303
Delta
7,809
45.85%
9,027
53.00%
197
1.16%
-1,218
-7.15%
17,033
Dickinson
5,922
48.63%
6,134
50.37%
121
0.99%
-212
-1.74%
12,177
Eaton
22,120
63.65%
12,083
34.77%
547
1.57%
10,037
28.88%
34,750
Emmet
5,910
58.49%
4,013
39.72%
181
1.79%
1,897
18.77%
10,104
Genesee
80,004
46.67%
88,967
51.89%
2,467
1.44%
-8,963
-5.22%
171,438
Gladwin
3,794
50.14%
3,719
49.15%
54
0.71%
75
0.99%
7,567
Gogebic
3,953
38.04%
6,341
61.02%
98
0.94%
-2,388
-22.98%
10,392
Grand Traverse
13,505
63.85%
7,263
34.34%
382
1.81%
6,242
29.51%
21,150
Gratiot
9,526
63.01%
5,429
35.91%
163
1.08%
4,097
27.10%
15,118
Hillsdale
9,307
62.23%
5,427
36.29%
221
1.48%
3,880
25.94%
14,955
Houghton
8,049
51.60%
7,352
47.13%
199
1.28%
697
4.47%
15,600
Huron
9,297
61.26%
5,721
37.70%
158
1.04%
3,576
23.56%
15,176
Ingham
66,729
55.92%
47,890
40.13%
4,708
3.95%
18,839
15.79%
119,327
Ionia
11,737
62.46%
6,820
36.29%
234
1.25%
4,917
26.17%
18,791
Iosco
5,500
52.39%
4,875
46.44%
123
1.17%
625
5.95%
10,498
Iron
3,224
41.77%
4,401
57.02%
93
1.20%
-1,177
-15.25%
7,718
Isabella
10,577
57.66%
7,281
39.69%
487
2.65%
3,296
17.97%
18,345
Jackson
32,873
56.23%
24,726
42.30%
858
1.47%
8,147
13.93%
58,457
Kalamazoo
51,462
59.09%
33,411
38.37%
2,212
2.54%
18,051
20.72%
87,085
Kalkaska
2,280
53.13%
1,957
45.61%
54
1.26%
323
7.52%
4,291
Kent
126,805
67.22%
59,000
31.28%
2,828
1.50%
67,805
35.94%
188,633
Keweenaw
606
47.68%
658
51.77%
7
0.55%
-52
-4.09%
1,271
Lake
1,598
41.96%
2,179
57.22%
31
0.81%
-581
-15.26%
3,808
Lapeer
12,349
55.59%
9,503
42.78%
363
1.63%
2,846
12.81%
22,215
Leelanau
4,240
62.33%
2,437
35.82%
126
1.85%
1,803
26.51%
6,803
Lenawee
18,397
55.02%
14,610
43.70%
428
1.28%
3,787
11.32%
33,435
Livingston
19,437
59.83%
12,415
38.22%
634
1.95%
7,022
21.61%
32,486
Luce
1,379
55.27%
1,099
44.05%
17
0.68%
280
11.22%
2,495
Mackinac
3,107
55.22%
2,452
43.58%
68
1.21%
655
11.64%
5,627
Macomb
132,499
51.24%
121,176
46.86%
4,928
1.91%
11,323
4.38%
258,603
Manistee
5,532
54.59%
4,479
44.20%
123
1.21%
1,053
10.39%
10,134
Marquette
12,984
49.34%
12,837
48.78%
494
1.88%
147
0.56%
26,315
Mason
6,812
59.15%
4,541
39.43%
163
1.42%
2,271
19.72%
11,516
Mecosta
7,287
59.63%
4,725
38.66%
209
1.71%
2,562
20.97%
12,221
Menominee
5,633
49.60%
5,596
49.27%
128
1.13%
37
0.33%
11,357
Midland
17,631
58.57%
11,959
39.73%
511
1.70%
5,672
18.84%
30,101
Missaukee
2,943
62.87%
1,688
36.06%
50
1.07%
1,255
26.81%
4,681
Monroe
20,676
46.36%
23,290
52.22%
631
1.41%
-2,614
-5.86%
44,597
Montcalm
10,439
60.36%
6,684
38.65%
171
0.99%
3,755
21.71%
17,294
Montmorency
1,882
52.03%
1,684
46.56%
51
1.41%
198
5.47%
3,617
Muskegon
35,548
56.06%
27,013
42.60%
846
1.33%
8,535
13.46%
63,407
Newaygo
8,258
58.78%
5,622
40.01%
170
1.21%
2,636
18.77%
14,050
Oakland
244,271
58.69%
164,266
39.47%
7,668
1.84%
80,005
19.22%
416,205
Oceana
5,236
59.51%
3,427
38.95%
135
1.53%
1,809
20.56%
8,798
Ogemaw
3,212
47.07%
3,545
51.95%
67
0.98%
-333
-4.88%
6,824
Ontonagon
2,462
43.91%
3,104
55.36%
41
0.73%
-642
-11.45%
5,607
Osceola
4,467
62.23%
2,603
36.26%
108
1.50%
1,864
25.97%
7,178
Oscoda
1,541
57.56%
1,108
41.39%
28
1.05%
433
16.17%
2,677
Otsego
3,155
53.01%
2,724
45.77%
73
1.23%
431
7.24%
5,952
Ottawa
49,196
74.12%
16,381
24.68%
793
1.19%
32,815
49.44%
66,370
Presque Isle
3,545
51.02%
3,334
47.99%
69
0.99%
211
3.03%
6,948
Roscommon
4,608
54.85%
3,691
43.94%
102
1.21%
917
10.91%
8,401
Saginaw
46,765
55.63%
36,280
43.15%
1,026
1.22%
10,485
12.48%
84,071
Sanilac
10,597
62.87%
6,042
35.84%
217
1.29%
4,555
27.03%
16,856
Schoolcraft
1,933
46.53%
2,158
51.95%
63
1.52%
-225
-5.42%
4,154
Shiawassee
15,113
54.52%
12,202
44.02%
406
1.46%
2,911
10.50%
27,721
St. Clair
26,311
52.74%
22,734
45.57%
844
1.69%
3,577
7.17%
49,889
St. Joseph
11,784
61.07%
7,306
37.86%
205
1.06%
4,478
23.21%
19,295
Tuscola
12,059
59.86%
7,932
39.38%
153
0.76%
4,127
20.48%
20,144
Van Buren
13,615
56.02%
10,366
42.65%
321
1.32%
3,249
13.37%
24,302
Washtenaw
56,807
50.86%
50,917
45.59%
3,965
3.55%
5,890
5.27%
111,689
Wayne
348,588
38.18%
548,767
60.11%
15,635
1.71%
-200,179
-21.93%
912,990
Wexford
5,670
54.96%
4,519
43.80%
128
1.24%
1,151
11.16%
10,317
Totals
1,893,742
51.83%
1,696,714
46.44%
63,293
1.73%
197,028
5.39%
3,653,749
Counties that flipped from Republican to Democratic
Counties that flipped from Democratic to Republican
See also
Notes
References


