User:Crossover1370
Welcome to the user page of Crossover1370!
I am a software engineer based in Goleta, California, United States. I am interested in mathematics, computer science, engineering, geography, and sports. I joined Wikipedia on July 30, 2019, just before my sophomore year of high school in nearby Santa Clarita.
My edits mostly consist of articles related to sports, geography (especially southern California geography), math, and science. Sometimes I contribute to articles on current events.
Education
- Saugus High School (2018-2022)
- University of California, Santa Barbara (2022-present)
Articles I have created
- Template:Santa Clarita (January 8, 2020)
- Castaic High School (December 23, 2020)
- Acton-Agua Dulce Unified School District (December 24, 2020)
- List of people from Santa Clarita, California (February 27, 2021)
- Santa Clarita Christian School (April 27, 2021)
- Portal:Basketball (June 18, 2021) - deleted in 2019 and recovered in 2021
- Timothy Canham (May 29, 2022)
- Draft:Tau (mathematical constant) (May 16, 2024)
- Module:Color temperature (April 30, 2026)
- I also updated Template:Color temperature to use the formulas in the module.
Articles I have contributed substantially to
- Santa Clarita, California (wrote about 70% of the article)
- Santa Clarita neighborhood articles:
- Several articles on Template:Santa Clarita
Userboxes
| ♂ | This contributor to Wikipedia is male. |
 | This user has been an extended confirmed user since April 12, 2020. (verify) |
| This editor is a Yeoman Editor and is entitled to display this Service Badge. |
| This user is a runner. |
| This user is an undergraduate student majoring in computer science. |
Gallery
-
 Periodic table, not highlighted
 -
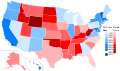
 2016 U.S. presidential election margins, by state
 -
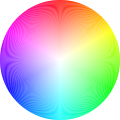 Color circle
 -
 Santa Clarita, CA location map
 -
 2020 U.S. presidential election margins, by state
 -
-
 Walk of Western Stars, Santa Clarita, CA
 -
 Unit circle with coordinates corresponding to cosine (x) and sine (y).
 -
 Graph of body temperature throughout the day
 -
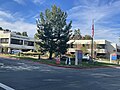
 College of the Canyons Performing Arts Center
 -
 Map of the United States shaded by population density (2020 census)
 -
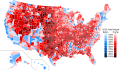 Map of the 2020 United States presidential election by county
 -
 Population growth from 2010 to 2020, by U.S. state. (Originally uploaded by Oogle12; I changed color scheme and added legend.)
 -
 US states by average altitude
 -
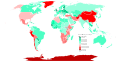 Countries and territories by average altitude
 -
 U.S. state population density maps, 2020 census (for all maps see Wikimedia Commons)
 -


.svg)


See also
Content Disclaimer
Informasi ini disarikan dari Wikipedia dan disajikan kembali untuk tujuan edukasi. Konten tersedia di bawah lisensi CC BY-SA 3.0. Kami tidak bertanggung jawab atas ketidakakuratan data yang bersumber dari kontribusi publik tersebut.
- The information displayed on this website is sourced in part or in whole from Wikipedia and has been adapted for the purpose of restating it. We strive to provide accurate and relevant information, however:
- There is no guarantee of absolute accuracy. Wikipedia is an open, collaborative project that can be edited by anyone, so information is subject to change.
- It is not intended to constitute professional advice. The content displayed is for informational and educational purposes only. For important decisions (e.g., medical, legal, or financial), please consult a professional.
- Content copyright. Wikipedia is licensed under the Creative Commons Attribution-ShareAlike License (CC BY-SA). This means that content may be reused with appropriate attribution and shared under a similar license.
- Responsible use. Any risk arising from the use of information from this website is entirely the responsibility of the user.