1984 United States presidential election in New Jersey
1984 United States presidential election in New Jersey
County Results
Reagan
50–60%
60–70%
70–80%
Mondale
50–60%
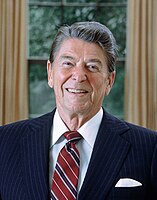
President Reagan campaigning in Hammonton, New Jersey . The 1984 United States presidential election in New Jersey took place on November 6, 1984. All 50 states and the District of Columbia , were part of the 1984 United States presidential election . Voters chose 16 electors to the Electoral College , which selected the president and vice president .
New Jersey was won by the Republican nominees, incumbent President Ronald Reagan of California and incumbent Vice President George H.W. Bush of Texas . Reagan and Bush defeated the Democratic nominees, former Vice President Walter Mondale of Minnesota and his running mate Congresswoman Geraldine Ferraro of New York .
Reagan carried New Jersey with 60.09% of the vote to Mondale’s 39.20%, a margin of 20.89%.[ 1]
Reagan also swept nearly every county in the state. Mondale’s only county victory was Essex County , where he defeated Reagan 55.1%–43.5%. This remains the last election in which a Republican presidential nominee has won heavily Democratic Hudson County and Mercer County ,[ 2] Reagan Democrats . Reagan's 1.93 million votes was the most received by a Republican in a presidential election in the state's history until Donald Trump received nearly 1.97 million votes in the state in 2024 .[ 3]
New Jersey weighed in for this election as 2.7% more Republican than the national average.
Campaign
Jesse Jackson 's voters were 81% black, 13% white, 4% Hispanic, and 2% were members of other groups.
Results
1984 United States presidential election in New Jersey
Party
Candidate
Votes
Percentage
Electoral votes
Republican Ronald Reagan (incumbent)1,933,630
60.09%
16
Democratic
Walter Mondale
1,261,323
39.20%
0
Workers World
Larry Holmes
8,404
0.26%
0
Libertarian
David Bergland
6,416
0.20%
0
New Alliance
Dennis Serrette
2,293
0.07%
0
Workers League
Edward Winn
537
0.02%
0
Communist Party
Gus Hall
1,564
0.05%
0
Socialist Workers
Melvin T. Mason
1,264
0.04%
0
Citizens
Sonia Johnson
1,247
0.04%
0
Totals
3,217,862
100.0%
16
Voter Turnout (Voting age/Registered)
57%/79%
Results by county
County
Ronald Reagan
Walter Mondale
Various candidates
Margin
Total votes cast
#
%
#
%
#
%
#
%
Atlantic
49,158
59.33%
33,240
40.12%
453
0.55%
15,918
19.21%
82,851
Bergen
268,507
63.22%
155,039
36.50%
1,172
0.28%
113,468
26.72%
424,718
Burlington
89,815
60.83%
57,467
38.92%
377
0.26%
32,348
21.91%
147,659
Camden
109,749
54.63%
90,233
44.92%
904
0.45%
19,516
9.71%
200,886
Cape May
28,786
68.06%
13,378
31.63%
133
0.31%
15,408
36.43%
42,297
Cumberland
29,398
57.47%
21,141
41.33%
616
1.20%
8,257
16.14%
51,155
Essex
136,798
43.49%
173,295
55.09%
4,450
1.41%
-36,497
-11.60%
314,543
Gloucester
54,041
62.08%
32,702
37.57%
307
0.35%
21,339
24.51%
87,050
Hudson
112,834
54.18%
94,304
45.29%
1,106
0.53%
18,530
8.89%
208,244
Hunterdon
29,737
72.39%
10,972
26.71%
370
0.90%
18,765
45.68%
41,079
Mercer
71,195
51.55%
66,398
48.07%
528
0.38%
4,797
3.48%
138,121
Middlesex
160,221
59.82%
104,905
39.17%
2,727
1.02%
55,316
20.65%
267,853
Monmouth
152,595
65.52%
79,382
34.08%
932
0.40%
73,213
31.44%
232,909
Morris
137,719
71.91%
53,201
27.78%
584
0.30%
84,518
44.13%
191,504
Ocean
124,391
70.23%
51,012
28.80%
1,710
0.97%
73,379
41.43%
177,113
Passaic
101,951
58.28%
69,590
39.78%
3,399
1.94%
32,361
18.50%
174,940
Salem
17,368
65.66%
8,935
33.78%
149
0.56%
8,433
31.88%
26,452
Somerset
66,303
66.77%
31,924
32.15%
1,069
1.08%
34,379
34.62%
99,296
Sussex
35,680
75.36%
11,502
24.29%
163
0.34%
24,178
51.07%
47,345
Union
135,446
59.11%
92,056
40.17%
1,638
0.71%
43,390
18.94%
229,140
Warren
21,938
67.07%
10,647
32.55%
122
0.37%
11,291
34.52%
32,707
Totals
1,933,630
60.09%
1,261,323
39.20%
22,909
0.71%
672,307
20.89%
3,217,862
Counties that flipped from Democratic to Republican
See also
References
Works cited


